5.9 KiB
PPStructure
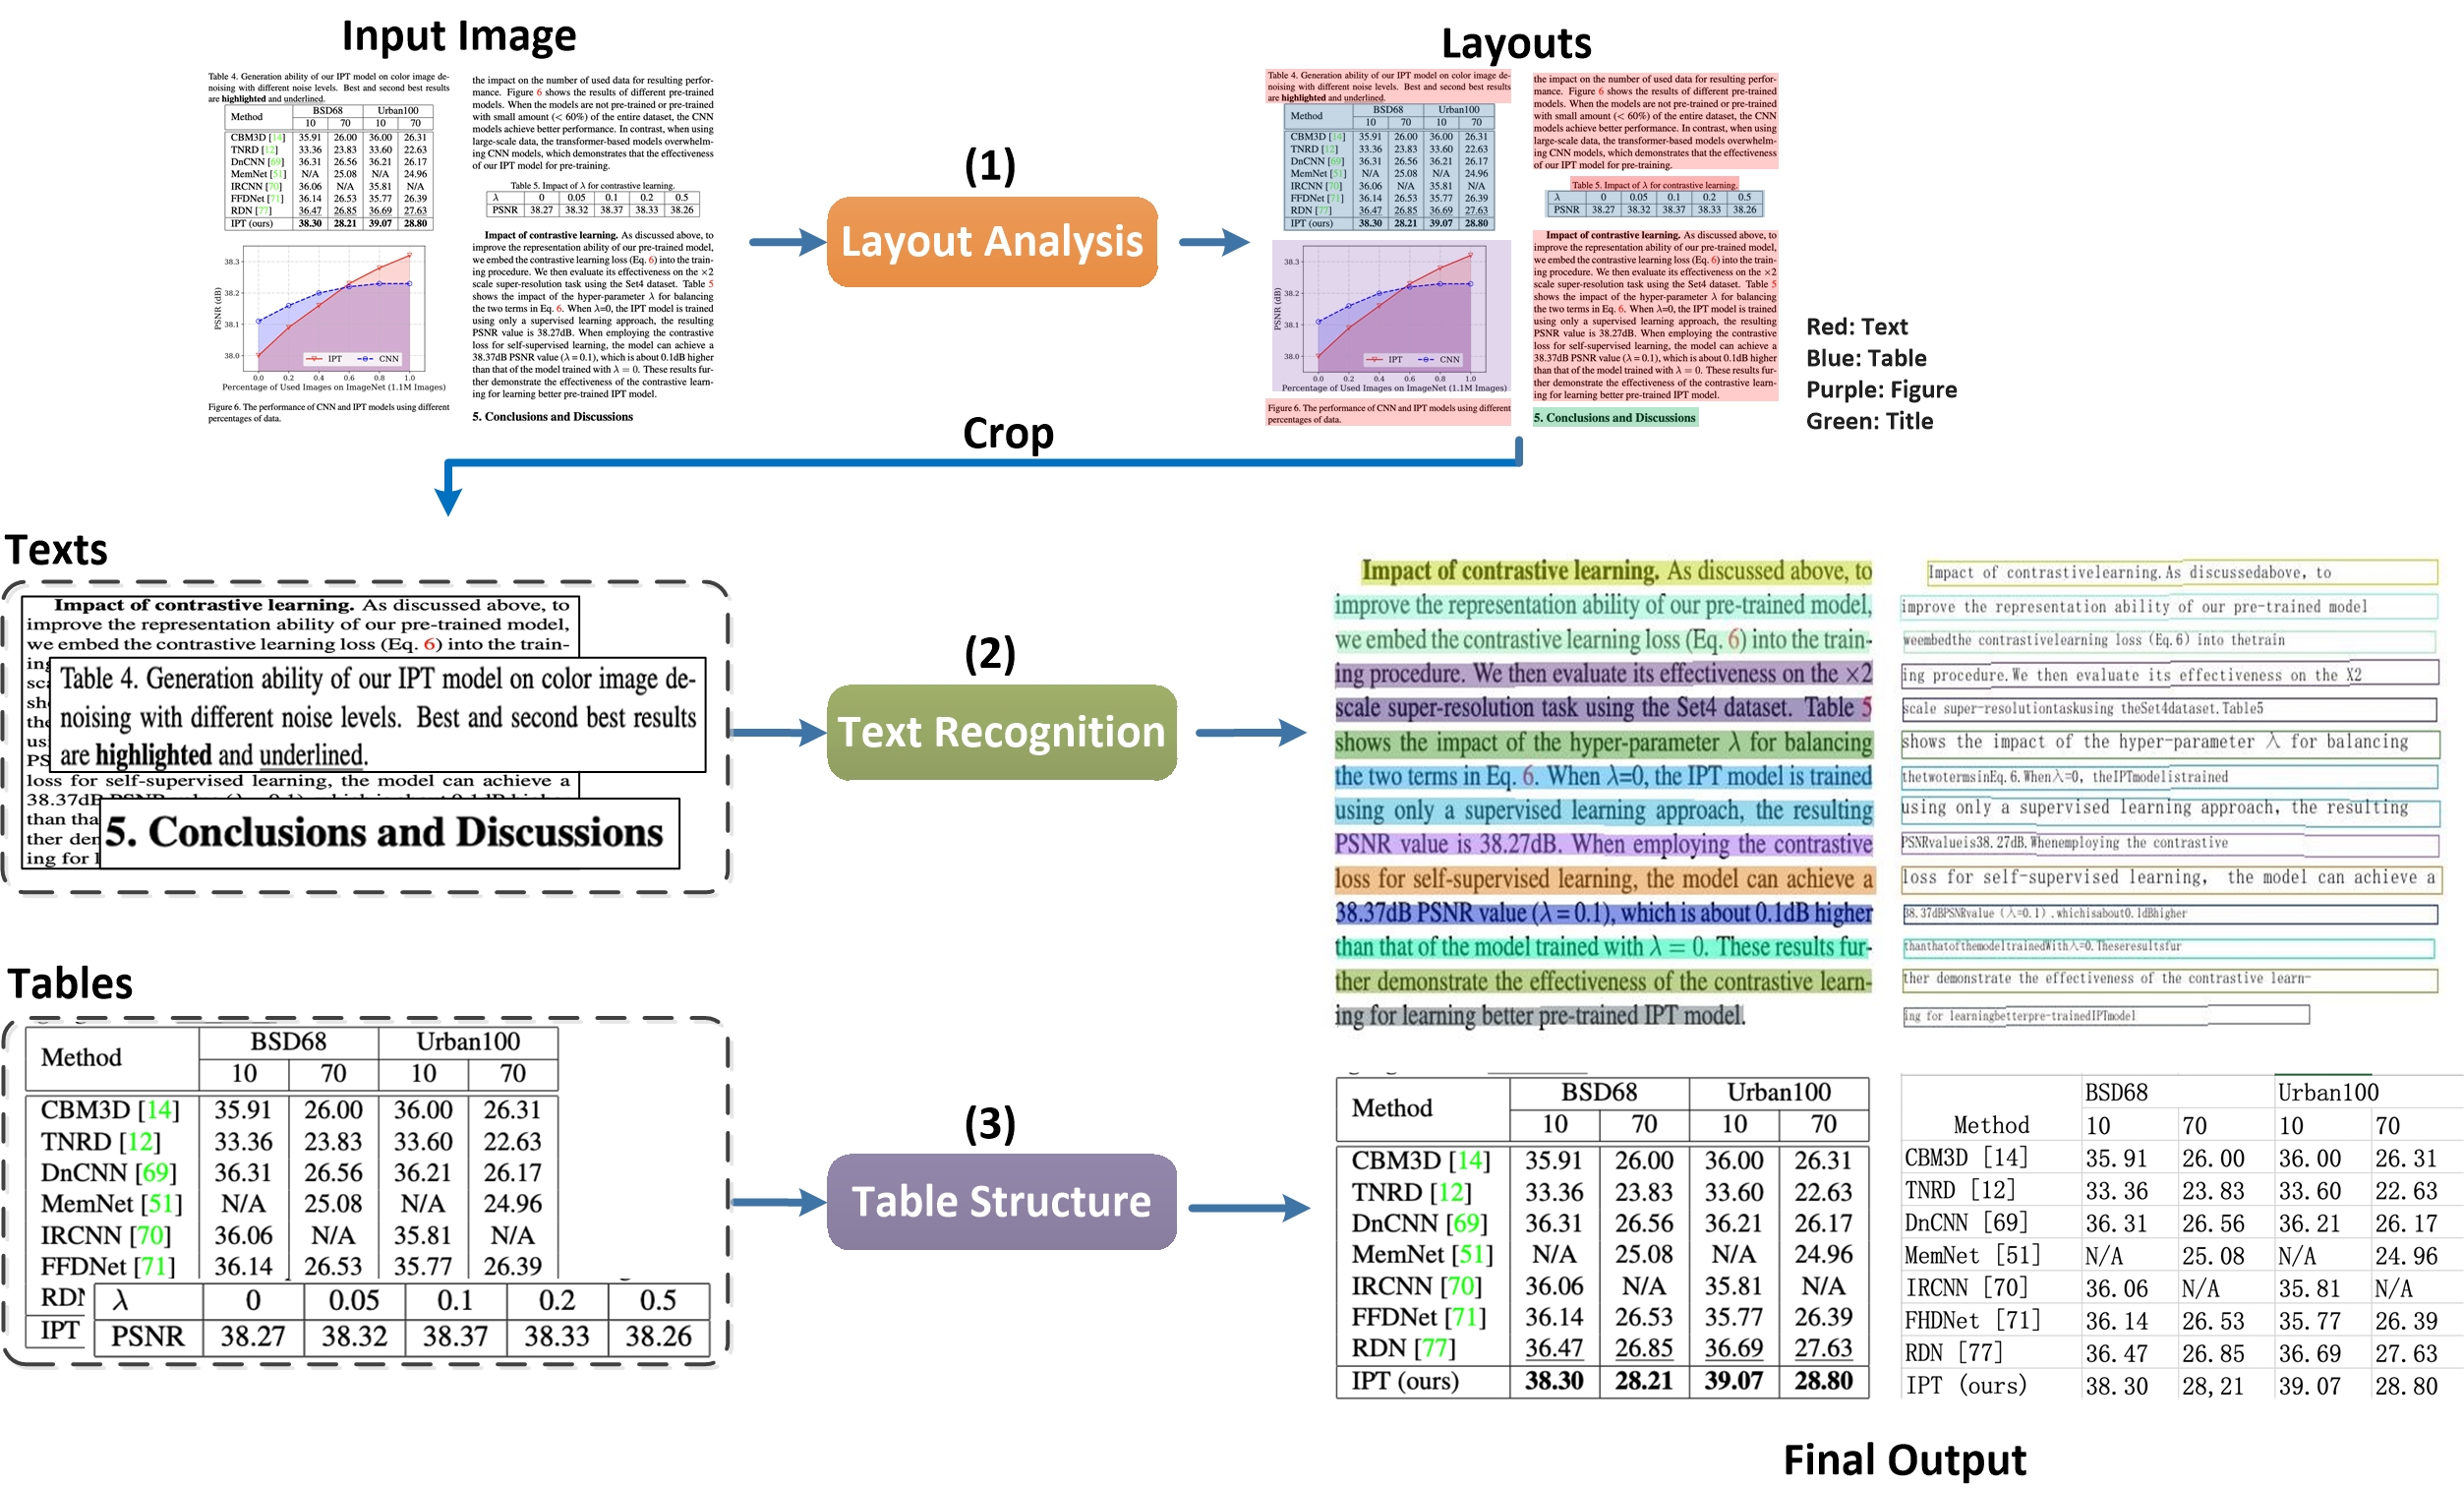
PPStructure is an OCR toolkit for complex layout analysis. It can divide document data in the form of pictures into text, table, title, picture and list 5 types of areas, and extract the table area as excel
1. Quick start
install
install paddleocr
ref to paddleocr whl doc
install layoutparser
pip3 install -U premailer https://paddleocr.bj.bcebos.com/whl/layoutparser-0.0.0-py3-none-any.whl
1.2 Use
1.2.1 Use by command line
paddleocr --image_dir=../doc/table/1.png --type=structure
1.2.2 Use by code
import os
import cv2
from paddleocr import PPStructure,draw_structure_result,save_structure_res

table_engine = PPStructure(show_log=True)

save_folder = './output/table'
img_path = '../doc/table/1.png'
img = cv2.imread(img_path)
result = table_engine(img)
save_structure_res(result, save_folder,os.path.basename(img_path).split('.')[0])

for line in result:
    print(line)

from PIL import Image

font_path = '../doc/fonts/simfang.ttf'
image = Image.open(img_path).convert('RGB')
im_show = draw_structure_result(image, result,font_path=font_path)
im_show = Image.fromarray(im_show)
im_show.save('result.jpg')
1.2.3 返回结果说明
The return result of PPStructure is a list composed of a dict, an example is as follows
[
  {   'type': 'Text',
      'bbox': [34, 432, 345, 462],
      'res': ([[36.0, 437.0, 341.0, 437.0, 341.0, 446.0, 36.0, 447.0], [41.0, 454.0, 125.0, 453.0, 125.0, 459.0, 41.0, 460.0]],
                [('Tigure-6. The performance of CNN and IPT models using difforen', 0.90060663), ('Tent  ', 0.465441)])
  }
]
The description of each field in dict is as follows
| Parameter | Description |
|---|---|
| type | Type of image area |
| bbox | The coordinates of the image area in the original image, respectively [left upper x, left upper y, right bottom x, right bottom y] |
| res | OCR or table recognition result of image area。 Table: HTML string of the table; OCR: A tuple containing the detection coordinates and recognition results of each single line of text |
1.2.4 Parameter Description:
| Parameter | Description | Default value |
|---|---|---|
| output | The path where excel and recognition results are saved | ./output/table |
| table_max_len | The long side of the image is resized in table structure model | 488 |
| table_model_dir | inference model path of table structure model | None |
| table_char_type | dict path of table structure model | ../ppocr/utils/dict/table_structure_dict.tx |
Most of the parameters are consistent with the paddleocr whl package, see doc of whl
After running, each image will have a directory with the same name under the directory specified in the output field. Each table in the picture will be stored as an excel, and the excel file name will be the coordinates of the table in the image.
2. PPStructure Pipeline
In PPStructure, the image will be analyzed by layoutparser first. In the layout analysis, the area in the image will be classified, including text, title, image, list and table 5 categories. For the first 4 types of areas, directly use the PP-OCR to complete the text detection and recognition. The table area will be converted to an excel file of the same table style via Table OCR.
2.1 LayoutParser
Layout analysis divides the document data into regions, including the use of Python scripts for layout analysis tools, extraction of special category detection boxes, performance indicators, and custom training layout analysis models. For details, please refer to document.
2.2 Table OCR
Table OCR converts table image into excel documents, which include the detection and recognition of table text and the prediction of table structure and cell coordinates. For detailed, please refer to document
3. Predictive by inference engine
Use the following commands to complete the inference.
python3 table/predict_system.py --det_model_dir=path/to/det_model_dir --rec_model_dir=path/to/rec_model_dir --table_model_dir=path/to/table_model_dir --image_dir=../doc/table/1.png --rec_char_dict_path=../ppocr/utils/dict/table_dict.txt --table_char_dict_path=../ppocr/utils/dict/table_structure_dict.txt --rec_char_type=EN --det_limit_side_len=736 --det_limit_type=min --output=../output/table --vis_font_path=../doc/fonts/simfang.ttf
After running, each image will have a directory with the same name under the directory specified in the output field. Each table in the picture will be stored as an excel, and the excel file name will be the coordinates of the table in the image.
Model List
| model name | description | config | model size | download |
|---|---|---|---|---|
| en_ppocr_mobile_v2.0_table_det | Text detection in English table scene | ch_det_mv3_db_v2.0.yml | 4.7M | inference model |
| en_ppocr_mobile_v2.0_table_rec | Text recognition in English table scene | rec_chinese_lite_train_v2.0.yml | 6.9M | inference model |
| en_ppocr_mobile_v2.0_table_structure | Table structure prediction for English table scenarios | table_mv3.yml | 18.6M | inference model |
