|
|
||
|---|---|---|
| .github | ||
| doc | ||
| docker | ||
| etc | ||
| src | ||
| .gitattributes | ||
| .gitignore | ||
| LICENSE | ||
| Makefile | ||
| README.md | ||
| README_EN.md | ||
| go.mod | ||
| go.sum | ||
README_EN.md

Nightingale is an enterprise-level cloud-native monitoring system, which can be used as drop-in replacement of Prometheus for alerting and management.
Introduction
Nightingale is an cloud-native monitoring system by All-In-On design, support enterprise-class functional features with an out-of-the-box experience. We recommend upgrading your Prometheus + AlertManager + Grafana combo solution to Nightingale.
- Multiple prometheus data sources management: manage all alerts and dashboards in one centralized visually view;
- Out-of-the-box alert rule: built-in multiple alert rules, reuse alert rules template by one-click import with detailed explanation of metrics;
- Multiple modes for visualizing data: out-of-the-box dashboards, instance customize views, expression browser and Grafana integration;
- Multiple collection clients: support using Promethues Exporter、Telegraf、Datadog Agent to collecting metrics;
- Integration of multiple storage: support Prometheus, M3DB, VictoriaMetrics, Influxdb, TDEngine as storage solutions, and original support for PromQL;
- Fault self-healing: support the ability to self-heal from failures by configuring webhook;
If you are using Prometheus and have one or more of the following requirement scenarios, it is recommended that you upgrade to Nightingale:
- Multiple systems such as Prometheus, Alertmanager, Grafana, etc. are fragmented and lack a unified view and cannot be used out of the box;
- The way to manage Prometheus and Alertmanager by modifying configuration files has a big learning curve and is difficult to collaborate;
- Too much data to scale-up your Prometheus cluster;
- Multiple Prometheus clusters running in production environments, which faced high management and usage costs;
If you are using Zabbix and have the following scenarios, it is recommended that you upgrade to Nightingale:
- Monitoring too much data and wanting a better scalable solution;
- A high learning curve and a desire for better efficiency of collaborative use in a multi-person, multi-team model;
- Microservice and cloud-native architectures with variable monitoring data lifecycles and high monitoring data dimension bases, which are not easily adaptable to the Zabbix data model;
If you are using open-falcon, we recommend you to upgrade to Nightingale:
- For more information about open-falcon and Nightingale, please refer to read Ten features and trends of cloud-native monitoring。
Quickstart
Documentation
Example of use

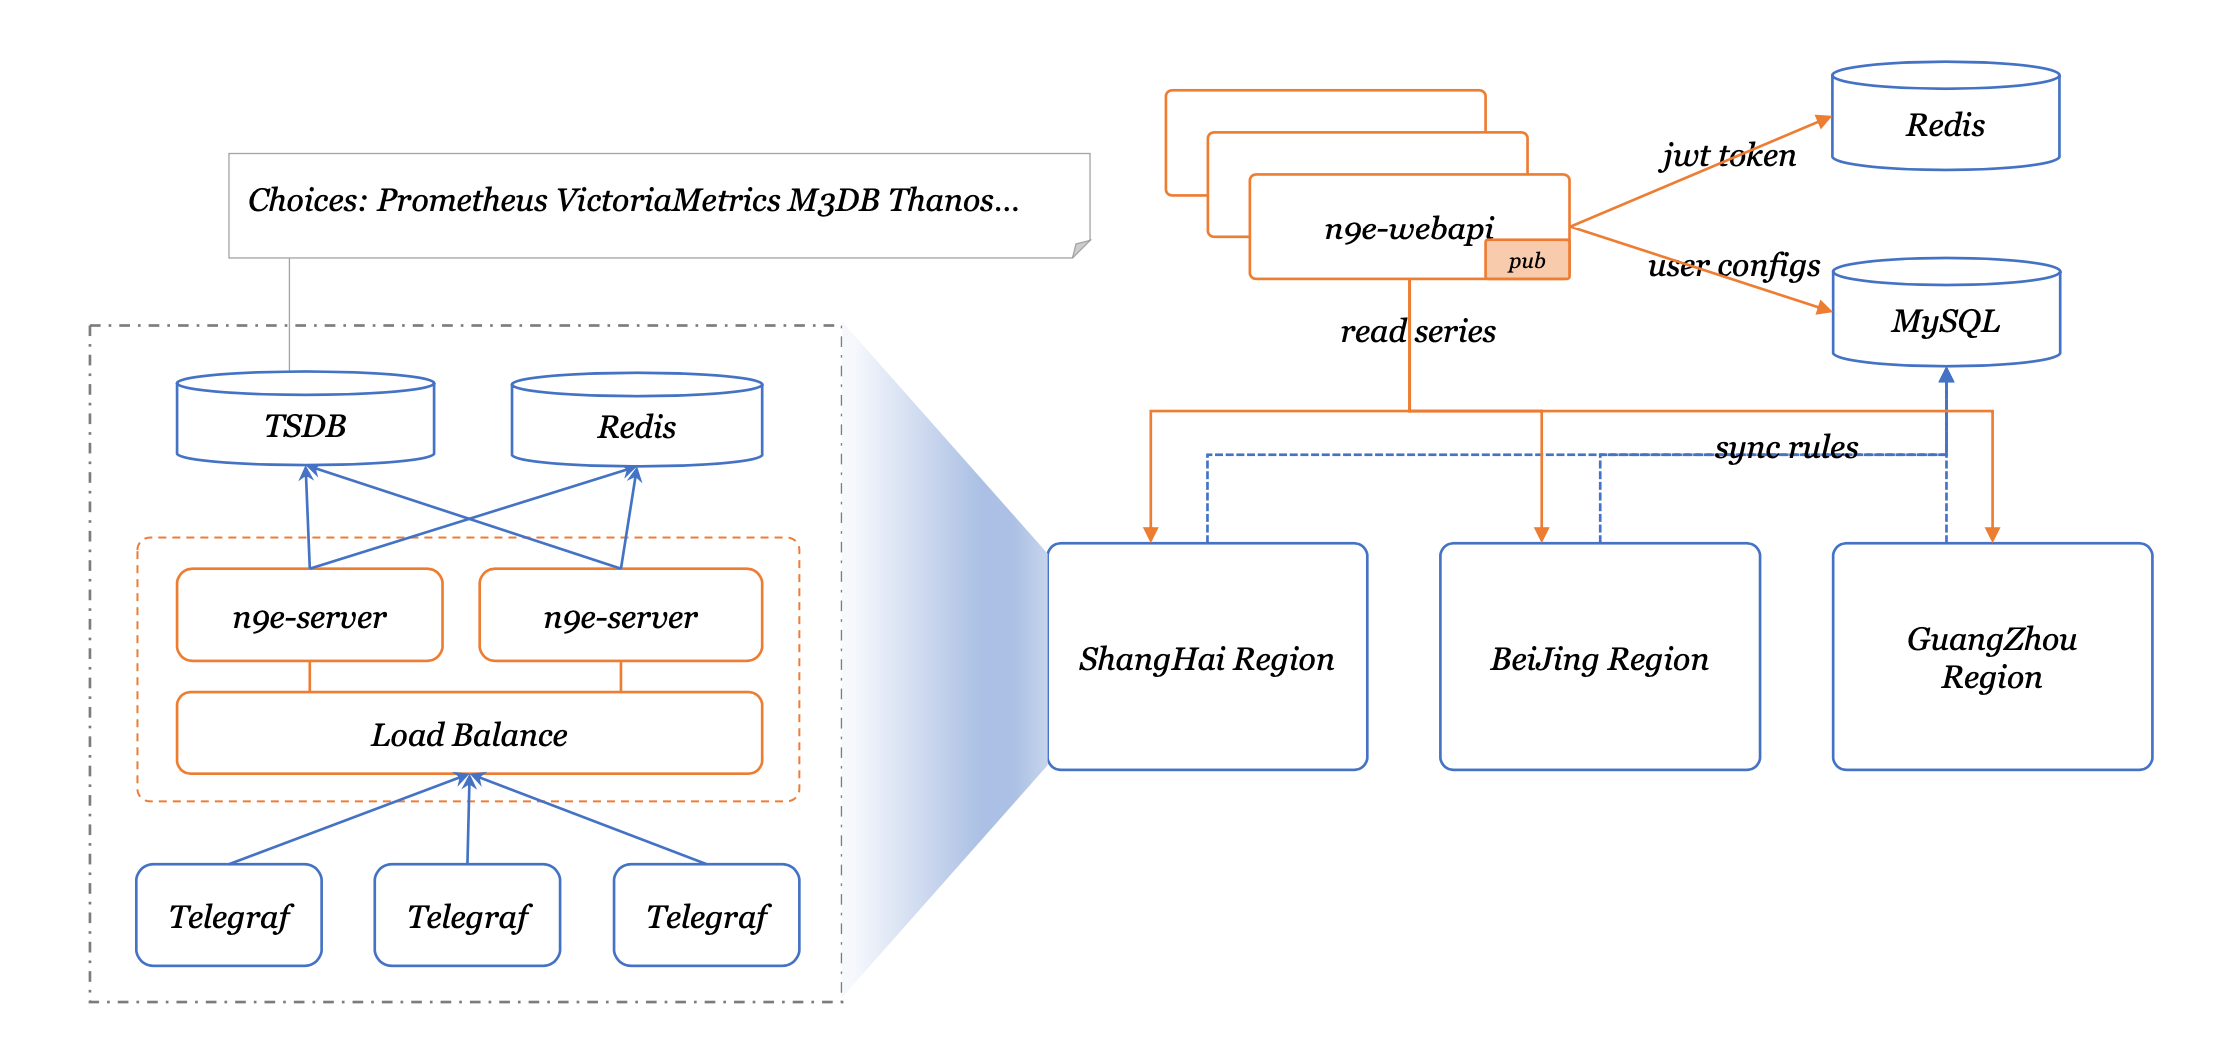
System Architecture
A typical Nightingale deployment architecture:

Typical deployment architecture using VictoriaMetrics as storage:

Contact us and feedback questions
- We recommend that you use github issue as the preferred channel for issue feedback and requirement submission;
- You can join our WeChat group - Nightingale WeChat Group;

Contributing
We welcome your participation in the Nightingale open source project and open source community in a variety of ways:
- Feedback on problems and bugs => github issue
- Additional and improved documentation => n9e.github.io
- Share your best practices and insights on using Nightingale => User Story
- Join our community events => Nightingale wechat group
- Submit code to make Nightingale better =>github PR
License
Nightingale with Apache License V2.0 open source license.