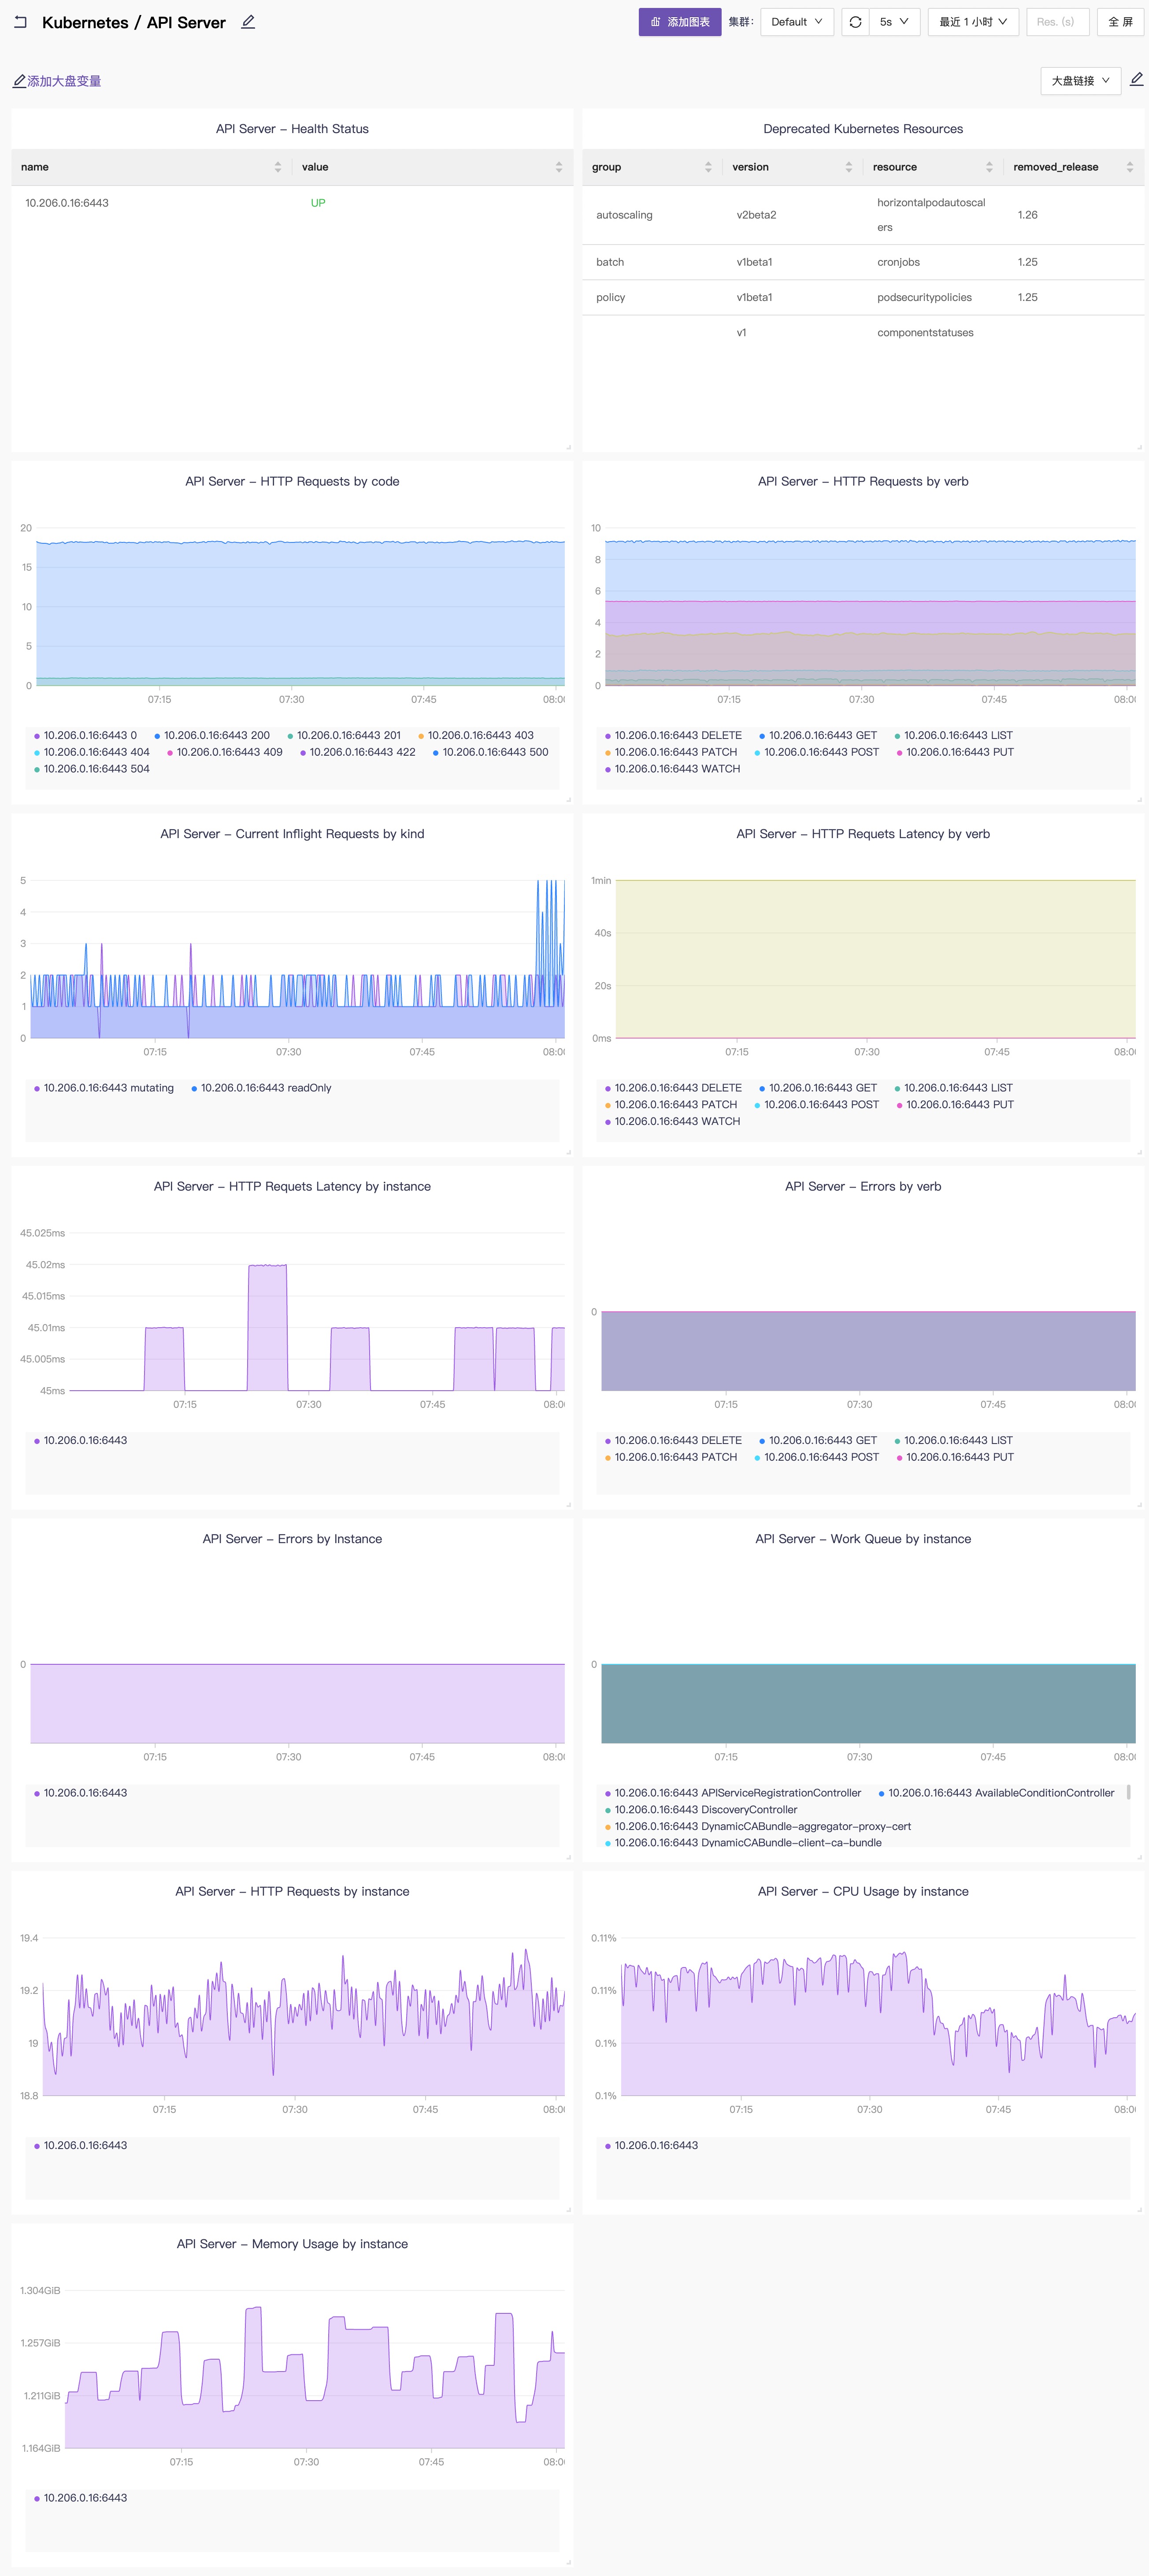
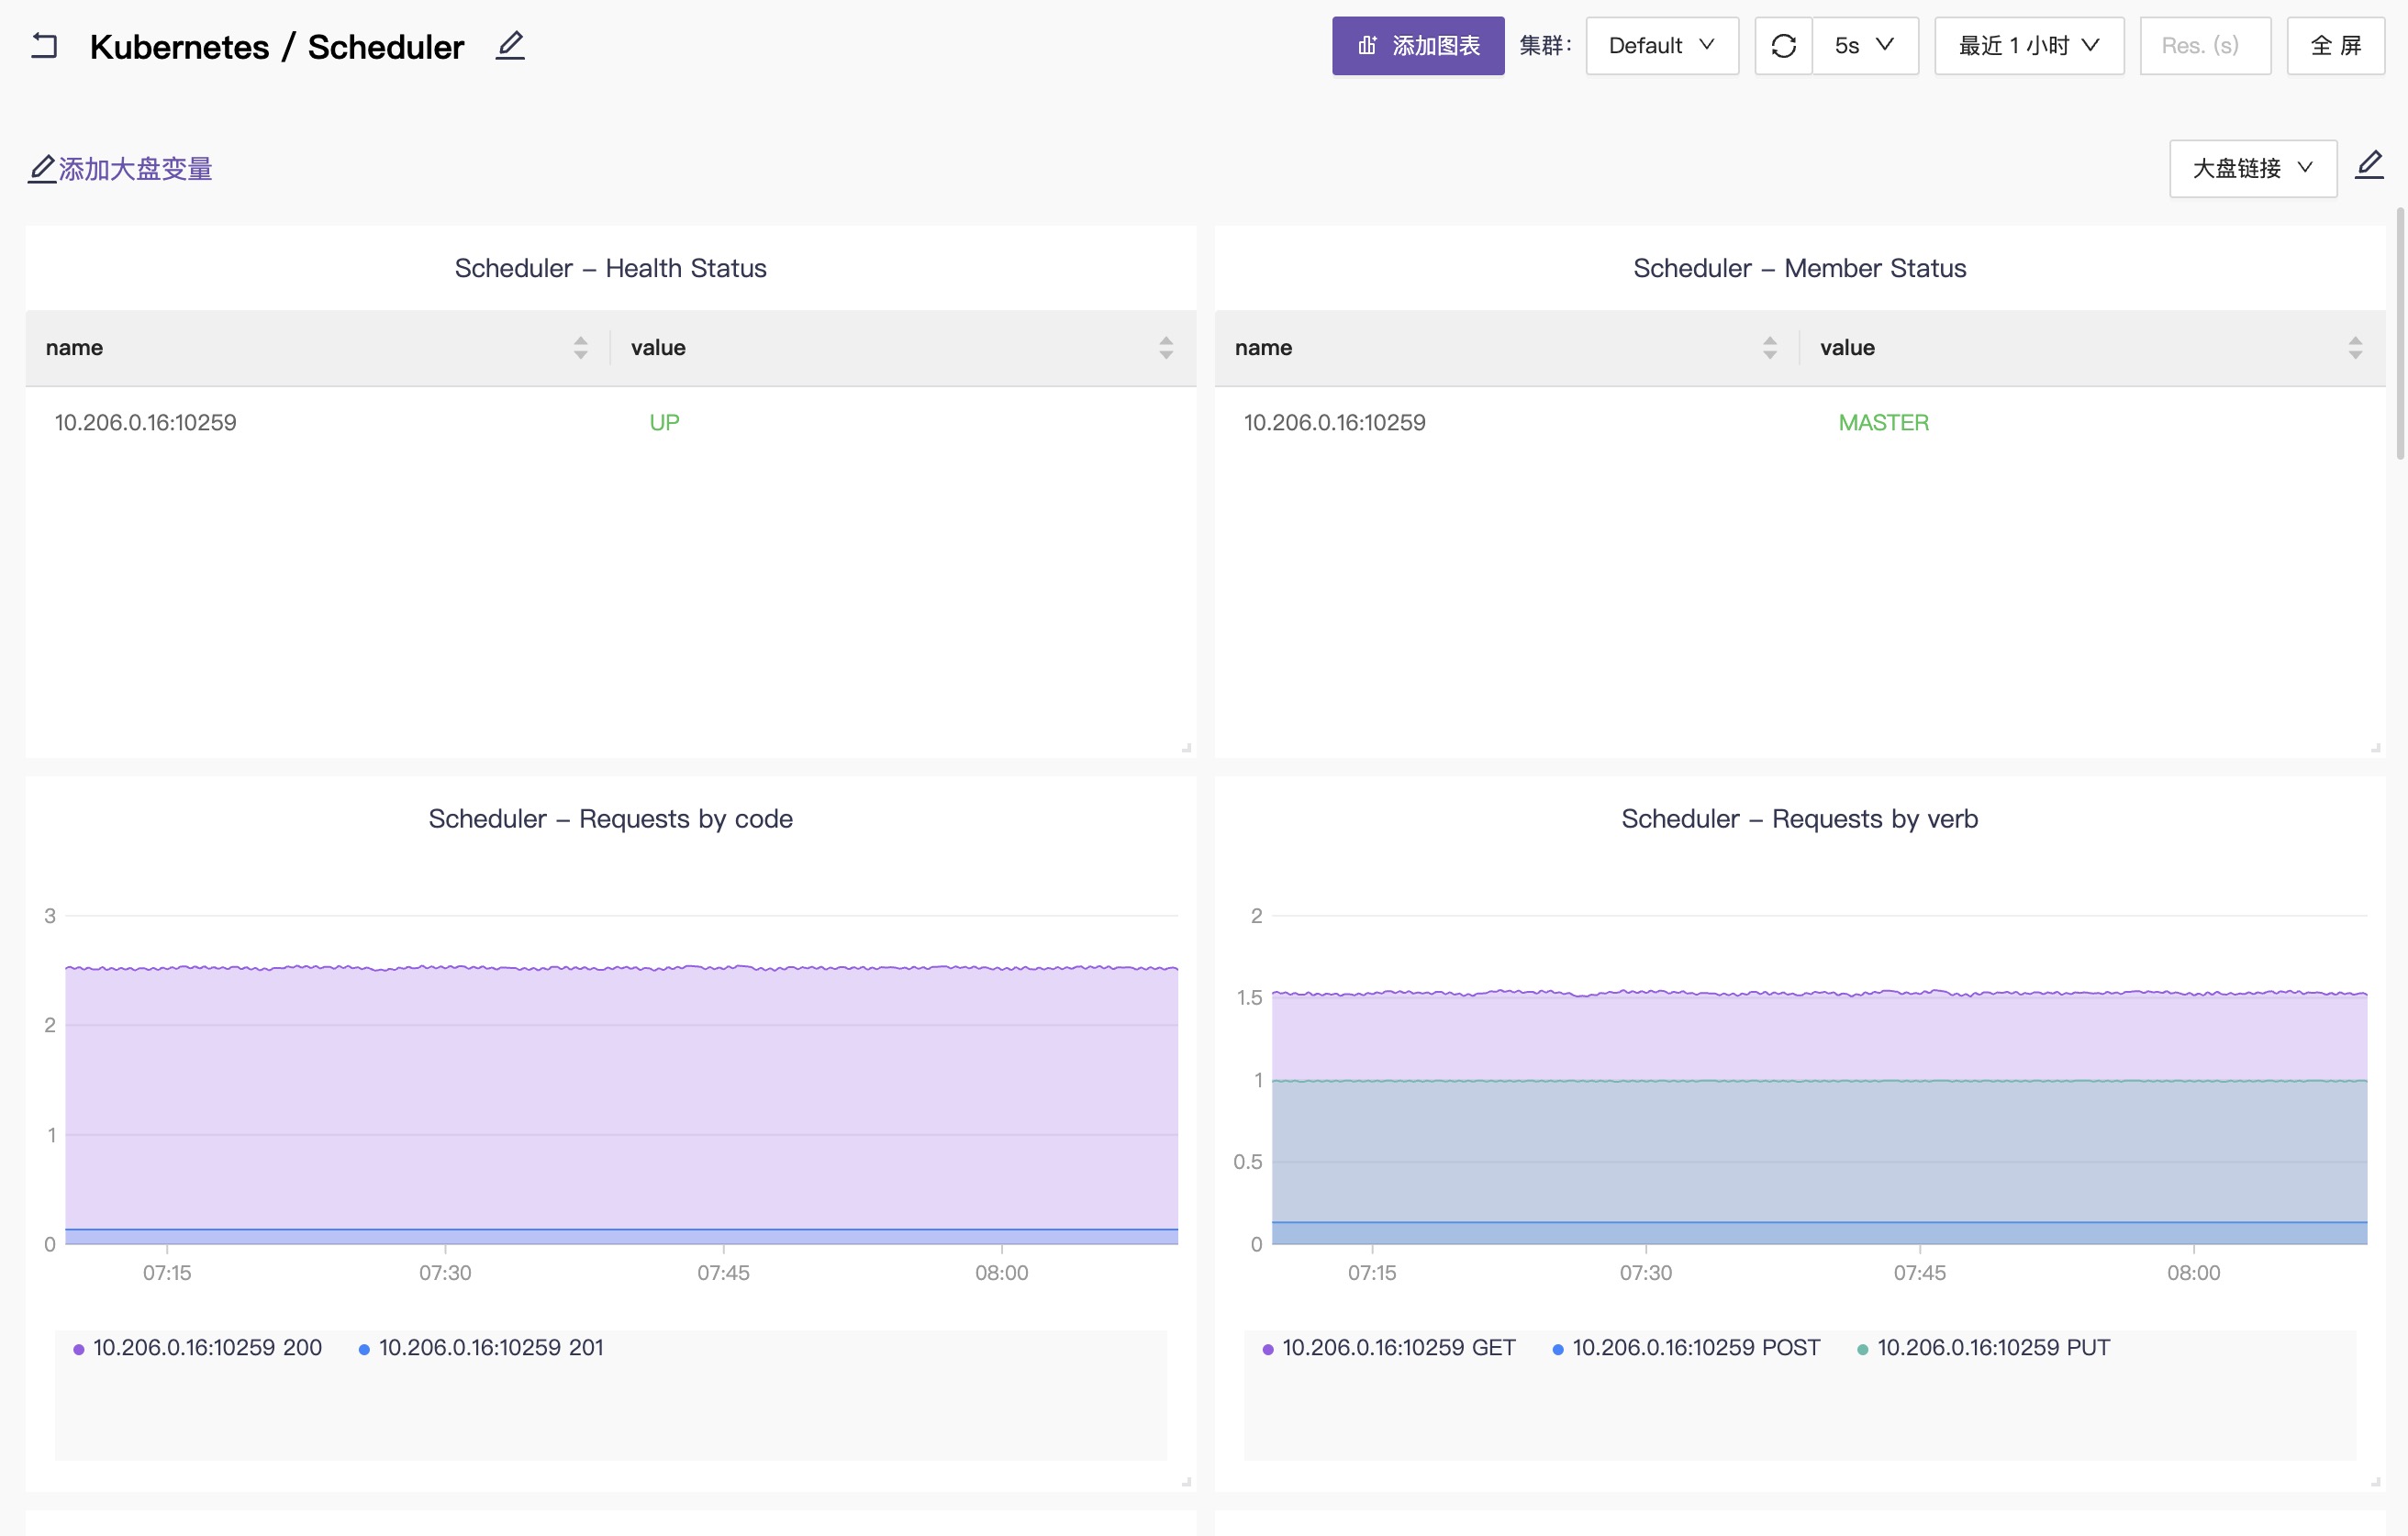
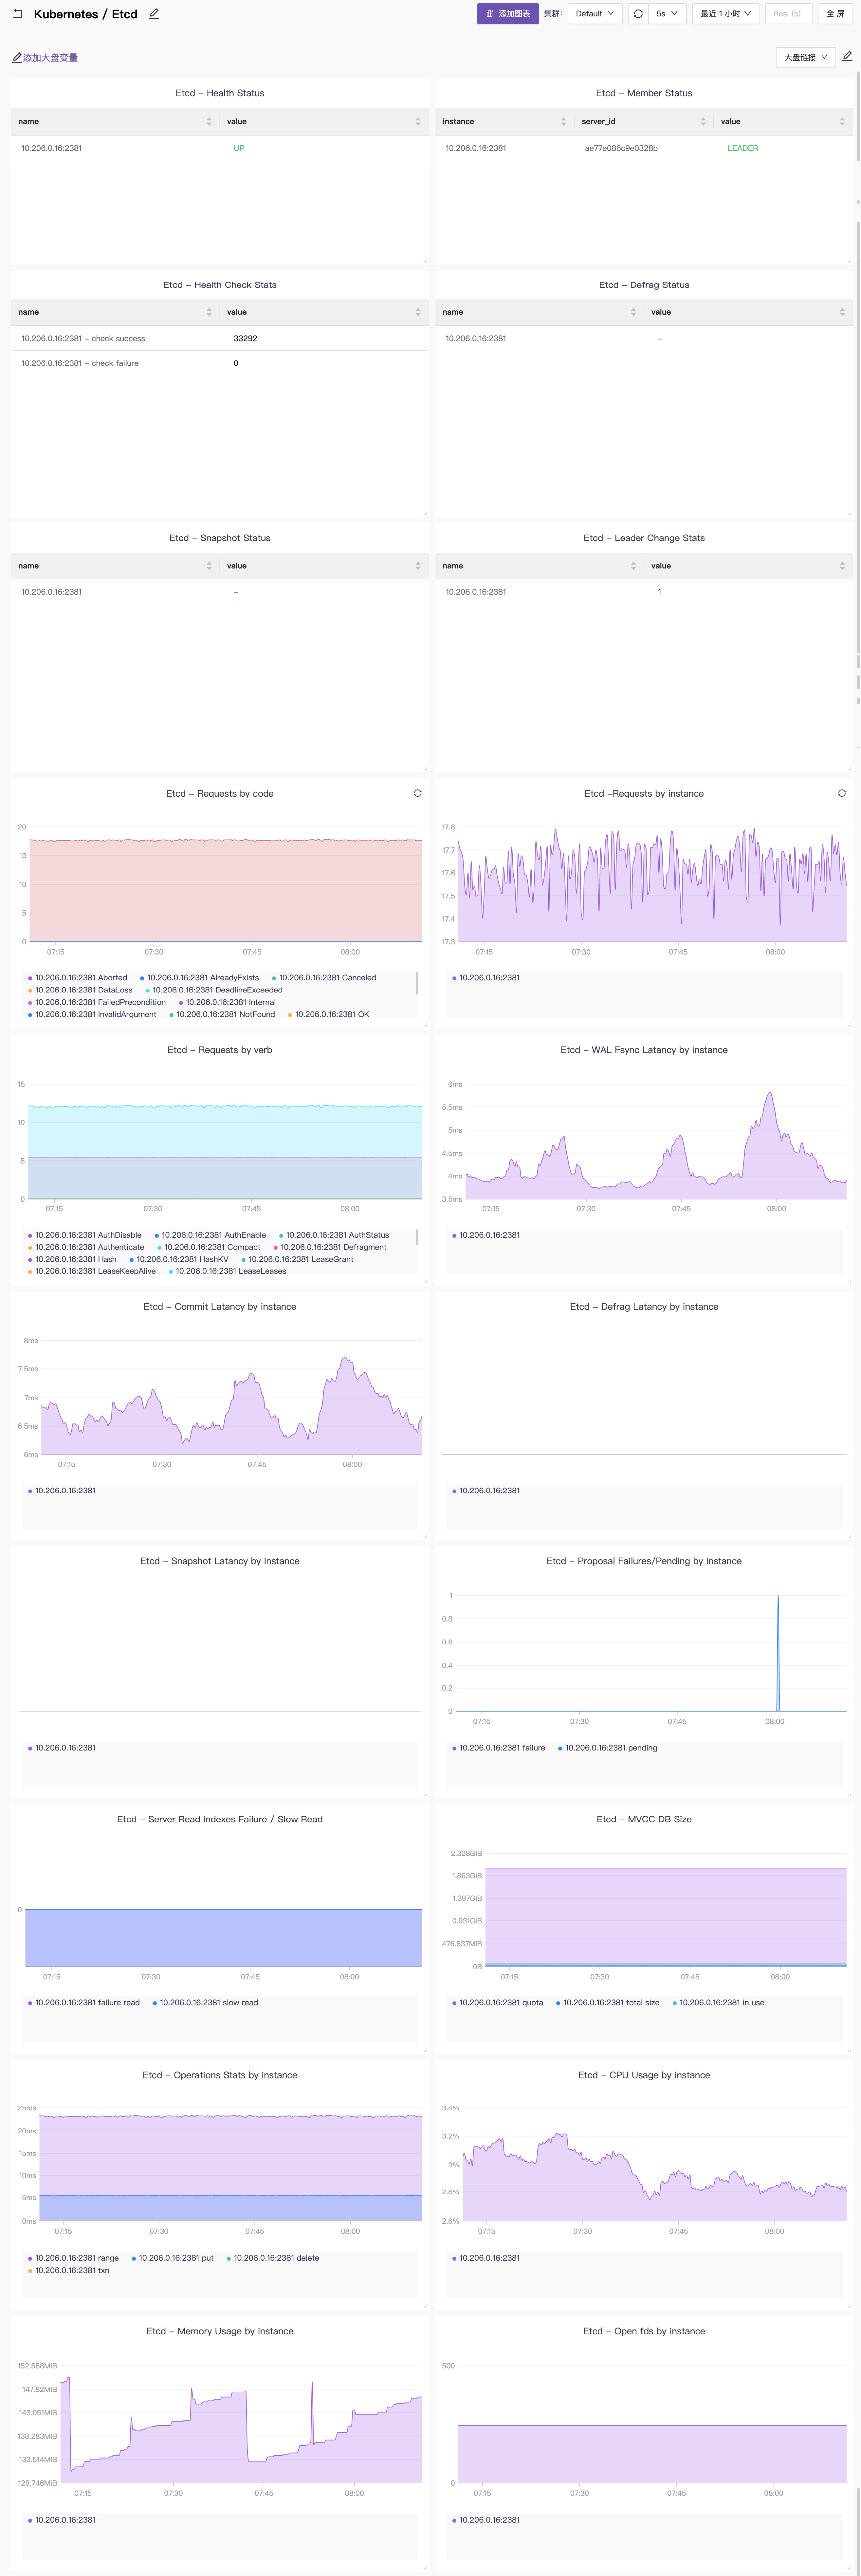
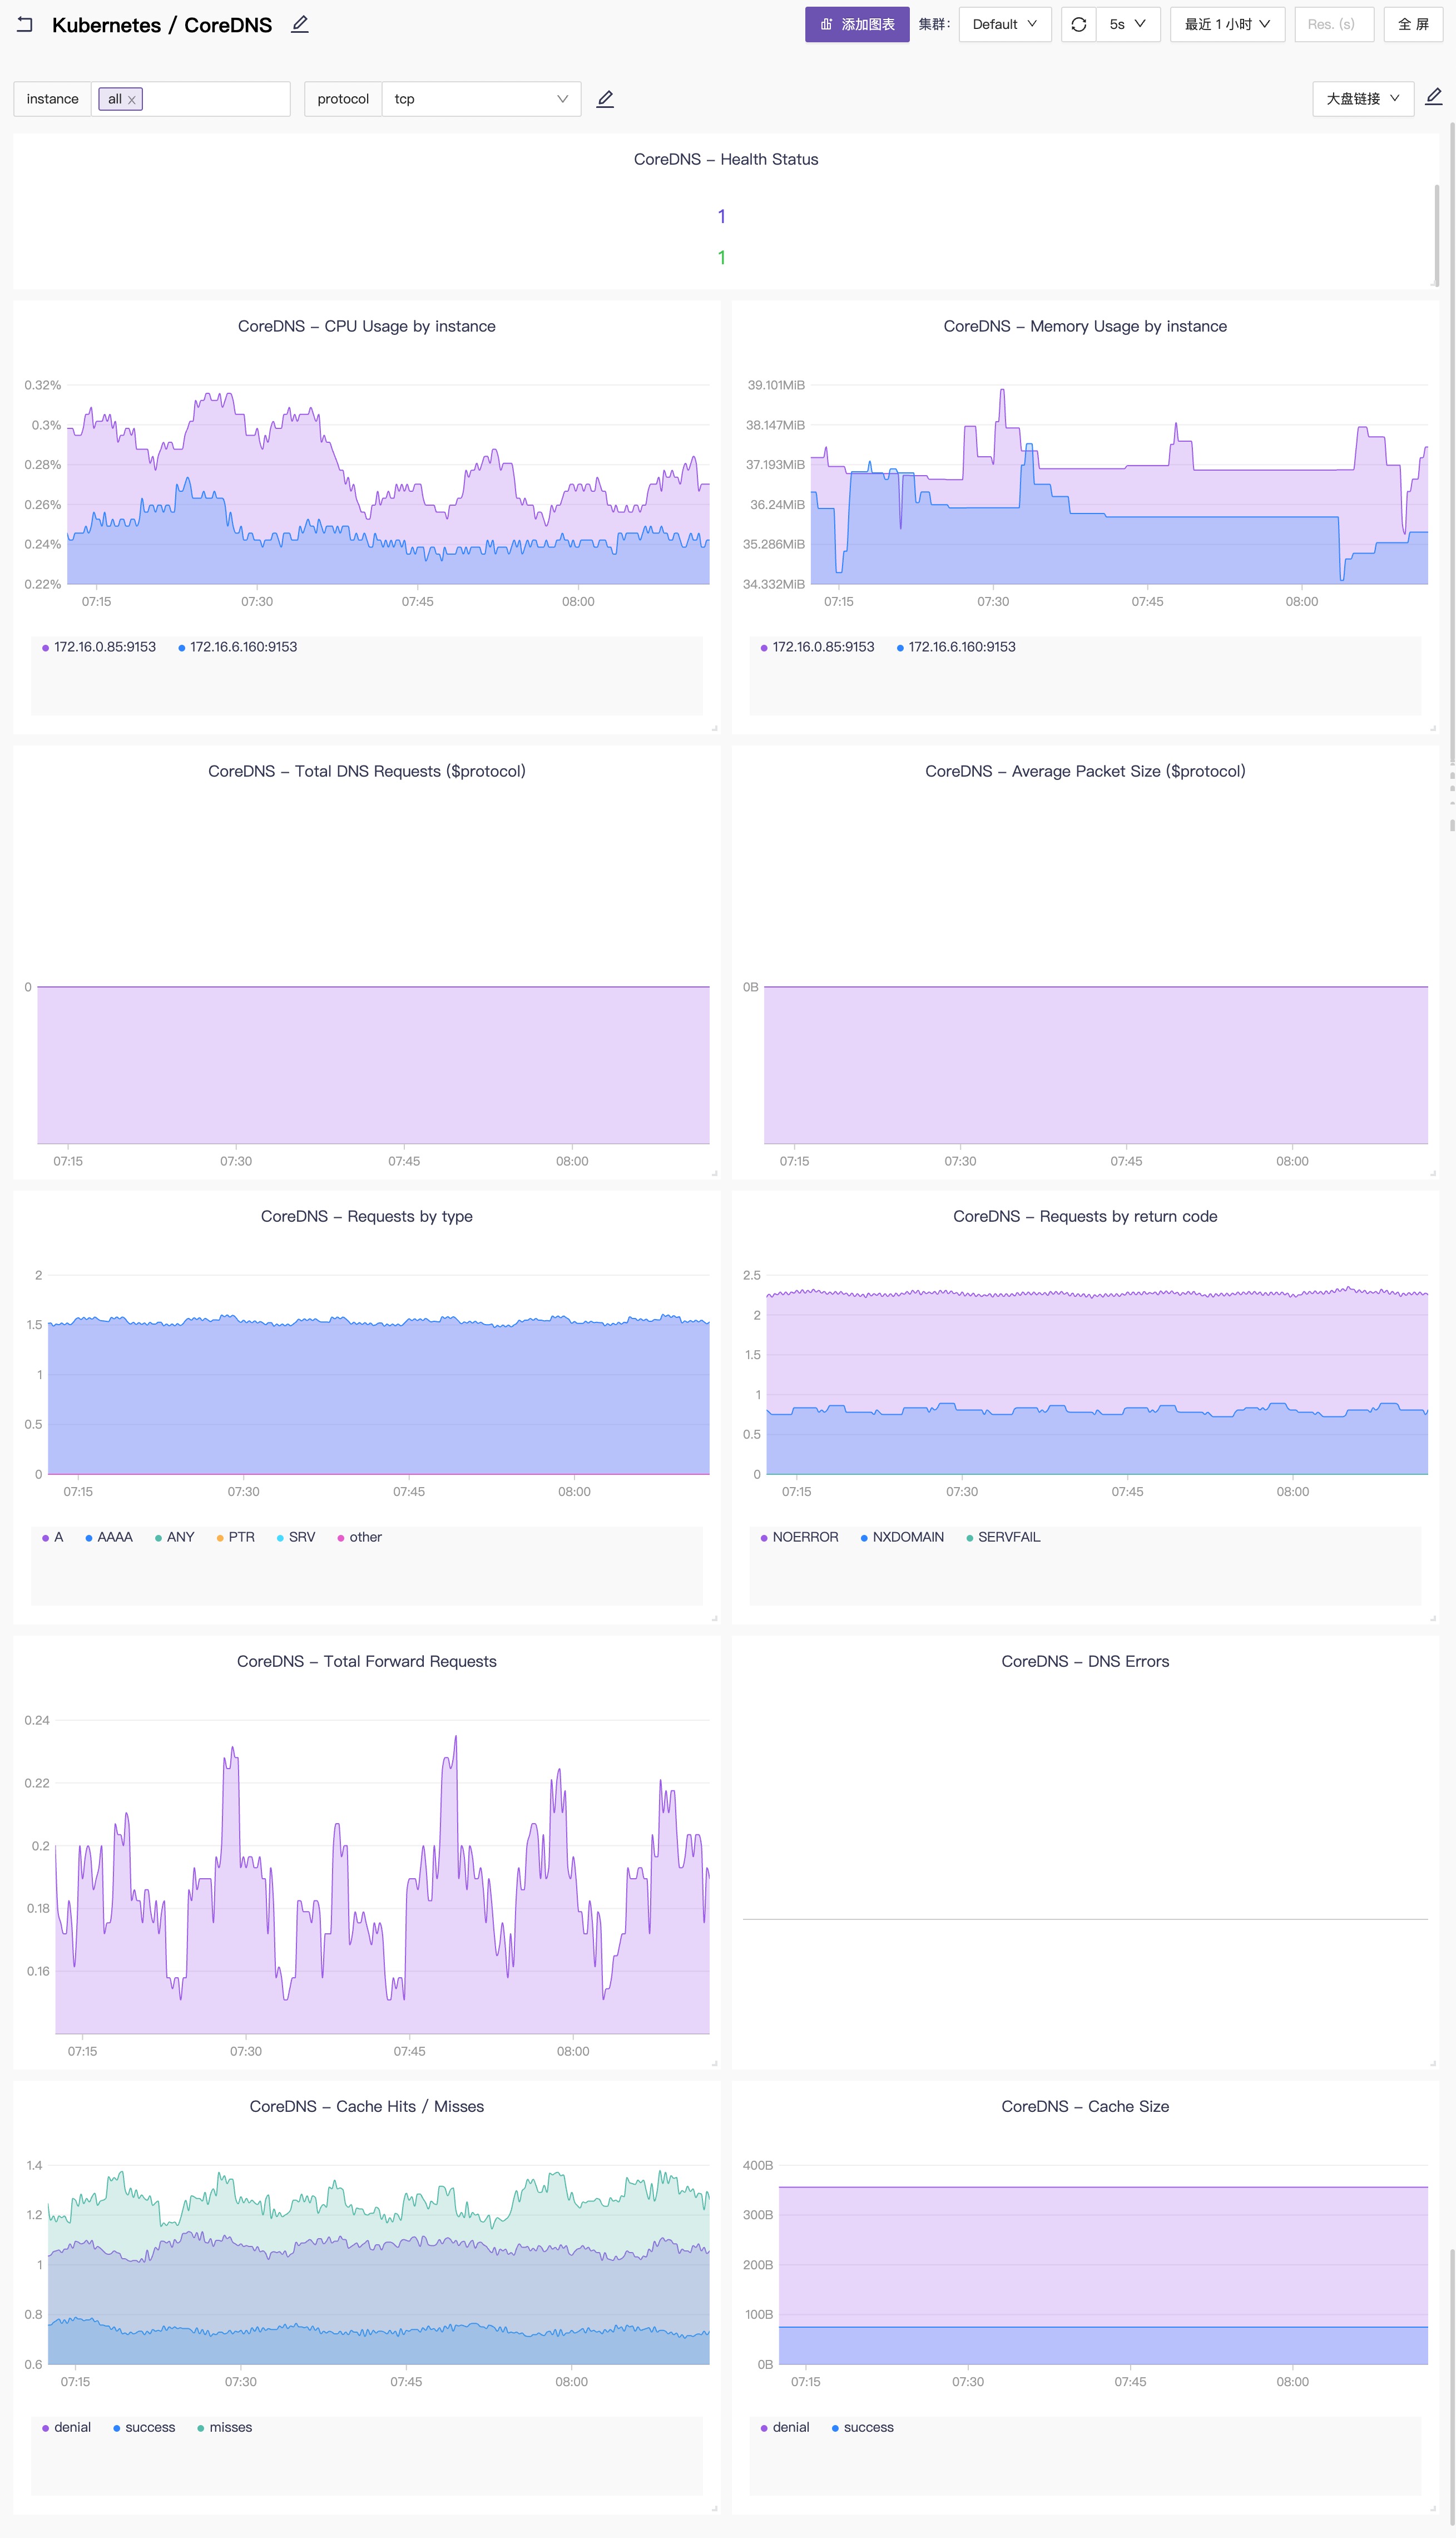
2.0 KiB
2.0 KiB
monitoring kubernetes control plane with plugin prometheus
if your control plane is in pod, for example, you use kubeadm build k8s cluster. Then kube-controller-manager, kube-scheduler and etcd need some extra work to be discovery.
create service for kube-controller-manager
kubectl apply -f controller-service.yaml- edit
/etc/kubernetes/manifests/kube-controller-manager.yaml, modify or add one line- --bind-address=0.0.0.0 - wait kube-controller-manager to restart
create service for kube-scheduler
kubectl apply -f scheduler-service.yaml- edit
/etc/kubernetes/manifests/kube-scheduler.yaml, modify or add one line- --bind-address=0.0.0.0 - wait kube-scheduler to restart
create service for etcd
kubectl apply -f etcd-service-http.yaml- edit
/etc/kubernetes/manifests/etcd.yaml, modify- --listen-metrics-urls=http://127.0.0.1:2381to- --listen-metrics-urls=http://0.0.0.0:2381 - wait etcd to restart
create all other objects with deployment
-
edit deployment.yaml and modify it with your own configure.
i. replace ${CATEGRAF_NAMESPACE} which located in ClusterRoleBinding part
ii. replace ${NSERVER_SERVICE_WITH_PORT} which located in ConfigMap part config.toml and in_cluster_scrape.yaml
if you choose
etcd-service.yamlwith https mode, thenkubectl apply -f etcd-service.yaml.iii. replace
{data of your etcd ca file}{data of your etcd client cert file}{data of your etcd client key file}in ConfigMap etcd-pki. -
kubectl apply -f deployment-etcd-http.yaml -n monitoring
Make sure that deployment.yaml always appears with etcd-service.yaml and deployment-etcd-http appears with etcd-service-http.yaml. They cannot be apply at the same time.


